Mobility · · 4 min read
Bicycle streets are working — here’s what the data shows
A bicycle street is more than a sign and a red road surface. Measure it, and you can see whether it keeps its promise: more cyclists, calmer car traffic and fewer dangerous overtakes.
UTO Technologies
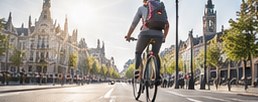
Bicycle streets have become a familiar sight in Belgium. The idea is simple: cyclists get priority across the full width of the road, cars are guests, may not overtake cyclists and stay at or below 30 km/h. But putting up a sign is not the same as changing behaviour. Is the bicycle street actually working? The honest answer: you only know once you measure.
Why gut feeling is not enough
There is no shortage of opinions about bicycle streets. Residents mostly notice the car that drives past too fast, cyclists remember that one dangerous overtake, and drivers often experience the street as a detour. All of these impressions are real, but together they do not add up to a reliable picture. A one-off count on a sunny Tuesday says little about a rainy Saturday or the school run.
For a mobility team that is a problem. A bicycle street costs money, takes political courage and sometimes meets resistance. Anyone who wants to adjust course or design the next street needs arguments that go beyond intuition.
What you can measure
With cameras and AI, a bicycle street can be followed day and night, without sensors in the road surface and without someone at the kerb with a tally sheet. The key indicators are:
- Cycling volume. How many cyclists use the street, per hour and per day, and how does that change after the redesign?
- Traffic mix. What share of traffic is made up of cyclists, cars, pedestrians and other road users?
- Speed. Does car traffic respect the speed limit, and when does it not?
- Overtaking. How often do cars overtake cyclists, even though that is forbidden in a bicycle street?
- Peak moments. When is it busy, and when do conflicts arise?
What the data reveals
Put these indicators side by side and the conversation changes. Instead of “it feels unsafe”, you can point to the hours when speeds are too high and the spots where overtaking concentrates. Instead of “nobody cycles there anyway”, you can show how cycling has developed since the street was redesigned.
That comparison works best if you start early. A measurement before the redesign gives you a baseline; a measurement afterwards shows the effect. After that, it pays to keep measuring: behaviour changes gradually, and an intervention that looks good after a month can look different after a year. Data also make visible what is going well. A bicycle street that works deserves to be the model for the next one.
From measuring to acting
Measuring is not a goal in itself. The value lies in what you do with it. If speeds turn out to be too high at certain times, an extra design measure may help, or targeted enforcement. If cars often overtake cyclists, that is a sign the street is being used as a through route. And if the number of cyclists clearly rises, you have a strong case for extending the network.
What matters is that the figures make sense to everyone. A dashboard that shows how each street is doing over time makes it easier to explain decisions to the mayor and aldermen, the council and the neighbourhood.
Data also let you compare bicycle streets with each other. Why does one street work better than another? Is it the width, its role in the network or the signage? By following the same indicators across several locations, you learn what makes a good bicycle street, and you carry those lessons into the next design.
What about privacy?
A fair question for any camera in public space. Monitoring needs movements, not people. That is why faces and number plates can be blurred and the system delivers anonymised counts, speeds and paths, not identifiable people. It is designed with the GDPR as its starting point.
Want to know how your bicycle streets are performing? Start with the question you want answered. The right measurements follow from there.